Data Processing Pipeline part 1
Companies around the world generate large amounts of data every day, this data need to be stored, processed and analyzed to make sense of it, without analyzing the data it will not be worth generating it at all, the results of these analytics will be used to improve the company’s products and user’s experience.
However generating this big amount of data, storing it, processing and analyzing it is not a trivial task at all, it needs a low latency, scalable, cost efficient and highly available infrastructure, in this article I will explain the requirements of this infrastructure and give an example of my own one which I created based on my three years experience of working as Linux Systems Administrator.
Introduction
A Data Processing Pipeline can be used to store, process and analyse log data from applications, these logs contain many information about user activity in the application, errors, warnings etc…
They are a valuable resource for investigating bugs and learning about user’s activity which can be used later to improve user’s experience.
Infrastructure requirements for Data Processing Pipeline
- Low Latency: When ingesting logs from the application to the system this must happen as quickly as possible and not delay response from the server to achieve this I used rabbitmq server to send logs from the application to it directly, rabbitmq will be running on the same server as the application server to minimize delay.
- Scalability: Today the application could be ingesting hundreds of logs per hour but in the future as the application becomes more and more famous we need the system to be able to scale with the increased traffic this can be achieved by using multiple logstash servers and apache kafka cluster to handle large amounts of logs per hour these tools enable the system to scale easily with increased load.
- High Availabilty: The process of ingesting logs to the system must continue even in the case of a failure of some servers in the system as the failure of the system could cause the failure of the entire application which is unacceptable, currently rabbitmq failures cause the server to be remved from the application cluster, in case of logstash failure the logs remain in rabbitmq until it comes back online and sent to it, right now I have a problem with kafka failures which cause data loss however I will work to solve this problem soon.
- Cost Effective: Adding more servers to existing infrastructure requires more money however having a Data Processing Pipeline can help greatly to react quickly to errors have a better idea about user’s bahaviour when using the application which can be used in improving the areas of application where users visit more and working on the areas where users visit less, also when traffic increases and number of logs increases the company’s income should increase and will be able to handle more costs to scale the infrastructure to handle more logs.
Infrastructure Description
In this section I will describe the infrastructure used here to create the data processing pipeline which consists of five components, rabbitmq, logstash, kafka, elasticsearch and kibana.
Each one of these five components plays a role in achieving the requirements mentioned in the above section.
The following steps show the data flow in the pipeline from application to visulaization
- First the application send logs to rabbitmq servers installed on the same host as the application servers
- The log data is sent to logstash servers which converts it to JSON and sends them to kafka servers for further processing.
- When data arrive at kafka servers it is processed using kafka streams applications, here any needed changes are applied to the data for example: replace numeric IDs with Strings etc…
- After data is processed it is sent to its final destination elasticsearch servers to be stored there and later visulized with kibana dashboards and visulaizations.
Hint: I used Confluent platform to run kafka servers.
In the following sections I will describe the installation and configuration of each component on a single server using the proper commands.
Rabbitmq
Rabbitmq is the most popular open source messaging software it can be used deliver messages from client applications to other applications, it provides low latency delivery and does not block the client application at all for further processing which makes it ideal for receiving messages from client applications at very low latency.
Installation
To install rabbitmq issue the following two commands:
  wget https://github.com/rabbitmq/rabbitmq-server/releases/download/rabbitmq_v3_6_14/rabbitmq-server_3.6.14-1_all.deb
  sudo dpkg -i rabbitmq-server_3.6.14-1_all.deb
  sudo apt-get install -fy
These two commands install rabbitmq version 3.6.14 on the server you can start the server using this command sudo service rabbitmq-server start
Make sure it is up and running with the following command sudo service rabbitmq-server status
Configuration
After rabbitmq is installed you need to configure it first delete the guest default user with the following command
sudo rabbitmqctl delete_user guest
Now create a rabbitmq virtual host which will be used for all the configurations used here
sudo rabbitmqctl add_vhost /log
Create a user and grant it full permissions on the above virtual host and give it the administrator tag.
  sudo rabbitmqctl add_user logger logger_pass
  sudo rabbitmqctl set_permissions -p /log logger ".*" ".*" ".*"
  sudo rabbitmqctl set_user_tags logger administrator
The next step is to enable the rabbitmq management plugin so we can use rabbitmqadmin to create an exchange
sudo rabbitmq-plugins enable rabbitmq_management
Download rabbitmqadmin script and make it executable with the following commands
 sudo wget -O /usr/local/bin/rabbitmqadmin https://raw.githubusercontent.com/rabbitmq/rabbitmq-management/master/bin/rabbitmqadmin
 sudo chmod u+x /usr/local/bin/rabbitmqadmin
Next create a rabbitmq exchange which will be used to route log messages from the application to the appropriate queue to be picked up later by logstash servers.
sudo rabbitmqadmin -u logger -p logger_pass -V /log declare exchange name=logging type=fanout
Now we need to create a rabbitmq queue and bind it with the exchange so any messages sent to the exchange will be routed to it
  sudo rabbitmqadmin -u logger -p logger_pass -V /log declare queue name=logs durable=true
  sudo rabbitmqadmin -u logger -p logger_pass -V /log declare binding source=logging destination_type=queue destination=logs
Now rabbitmq is ready to receive log messages from applications and send them to logstash servers once they are configured to read logs from rabbitmq, I will describe this in the next section.
logstash
Logstash is an open source server side data processing pipeline, it can receive data from various inputs (rabbitmq in our case here) transform them (to JSON here) and then send them to various outputs (kafka in our case here).
Here logstash is used to filter the required fields from each log message and send them to kafka topics where they are further processed before sending them finally to elasticsearch.
Installation
Before installing logstash we need to install java 8 with the following commands:
sudo add-apt-repository ppa:openjdk-r -y
sudo apt-get update
sudo apt-get install openjdk-8-jre openjdk-8-jdk -y
Now install logstash with these commands
  wget https://artifacts.elastic.co/downloads/logstash/logstash-5.6.2.deb
  sudo dpkg -i logstash-5.6.2.deb
Now logstash is installed and ready to be configured.
Configuration
We will configure logstash using a single file to define inputs, filters and outputs.
Create a new file using your favourite editor in this path /etc/logstash/conf.d/log.conf
  input {
      rabbitmq {
            host => "localhost"
            port => 5672
            queue => "logs"
            durable => true
            passive => true
            exchange => "logging"
            user => "logger"
            password => "logger_pass"
            vhost => "/log"
      }
}

filter {
  if [@metadata][rabbitmq_properties][datetime] {
  date {
        match => ["[@metadata][rabbitmq_properties][datetime]", "UNIX"]
  }
  }
  json {
        source => "%{@timestamp} - %{level_name}.%{channel} - %{context} - %{message} - %{extra}"
  }
}

output {
    kafka {
          topic_id => logs_data
          codec => "json"
          bootstrap_servers => "localhost:9092"
    }
}
From the above file we see three main sections, the first one is the input section here we are using rabbitmq input type to read messages from rabbitmq queue.
The second one is the filter section, here we use date filter to parse the date and use the json filter to convert log message to a json object using the required properties.
The third one is the output section where we define kafka output and send messages to logs_data topic.
Elasticsearch
Elasticsearch is a distributed, RESTful search and analytics engine capable of solving a growing number of use cases, here we use it to store our data and analyse it, without it our data remains data with no information about it and we cannot infer any results from it.
Installation
Elasticsearch can be easily installed by executing these commands
  wget https://artifacts.elastic.co/downloads/elasticsearch/elasticsearch-5.6.2.deb
  sudo dpkg -i elasticsearch-5.6.2.deb
Start it with the following command sudo service elasticsearch start, now elasticsearch
is up and running and ready to accept connections on port 9200.
Configuration
If your server runs on 4 GB of memory you need to modify the heap size for elasticsearch
to be able to run other components together, open the file /etc/elasticsearch/jvm.options
and change -Xms2g and -Xmx2g to -Xms1g and -Xmx1g respectively then restart elasticsearch
with this command sudo service elasticsearch restart.
kafka
Kafka is used for building real-time data pipelines and streaming apps. It is horizontally fault-tolerant and fast, we will use confluent platform for running kafka server.
Installation
Use the following commands to install confluent platform which includes all the required components to run apache kafka.
    wget -qO - https://packages.confluent.io/deb/4.0/archive.key | sudo apt-key add -
    sudo add-apt-repository "deb [arch=amd64] https://packages.confluent.io/deb/4.0 stable main"
    sudo apt-get update && sudo apt-get install confluent-platform-oss-2.11 -y
The previous commands install confluent platform open source version on your server.
You can start confluent with the following command sudo confluent start
Configuration
We will use the kafka elasticsearch connector to send data from kafka topics to elasticsearch servers where they are stored and can be visualized with kibana later.
We need to configure kafka connect to send data from logs_data topic to elasticsearch servers, the data is already in JSON format so no need to specify any schema or elasticsearch mappings.
Edit this file /etc/kafka-connect-elasticsearch/quickstart-elasticsearch.properties
to specify options for kafka elasticsearch connector
  name=elasticsearch-sink
  connector.class=io.confluent.connect.elasticsearch.ElasticsearchSinkConnector
  tasks.max=1
  topics=logs_data
  key.ignore=true
  schema.ignore=true
  connection.url=http://localhost:9200
  type.name=kafka-connect
  value.converter=org.apache.kafka.connect.json.JsonConverter
  value.converter.schemas.enable=false
The most important option is connection.url which points to the elasticsearch server
used for indexing data, the topics option specifies the kafka topics used as input
for the connector, value.converter specifies the converter used for data here it is
JsonConverter because data is already in JSON format and elasticsearch accepts JSON
data by default for indexing.
You need to wait few seconds to give confluent the chance to start before continuing.
To start the connector use this command sudo confluent load elasticsearch-sink
now the connector is up and running and any data written to logs_data topic will
be indexed in elasticsearch server.
To make sure that kafka elasticsearch connector is running use the following command
sudo confluent status connectors
Now after we finished installing and configuring kafka using the confluent platform we can move to installing and configuring elasticsearch server.
Kibana
Kibana is the visulaization layer for elasticsearch, it helps to visualize and discover elasticsearch data easily using a web interface, you can create custom visulaizations and dashboards to view your data.
Installation
Kibana can be installed with the following commands
  wget https://artifacts.elastic.co/downloads/kibana/kibana-5.6.2-amd64.deb
  sudo dpkg -i kibana-5.6.2-amd64.deb
Configuration
Open the file /etc/kibana/kibana.yml and edit the server.host option, set it
to “0.0.0.0” so you can connect to kibana web interface from anywhere.
Now restart kibana for changes to take effect sudo service kibana restart
To view kibana web interface using any web browser open http://<ip_address>:5601
Now we will explain the use of a simple web application written in symfony framework to emit logs to our pipeline and visualize the logs in kibana.
Web Application
Now after we finished preparing the pipeline it is time to use it, I created a small symfony application in PHP which contains a form that can be used to send log messages to our pipeline you can clone it using this command
git clone https://github.com/mohsenSy/LoggingInfrastructure.git
Now we must install composer, apache, php and some php extensions to make sure the app works
sudo apt-get install -y php5 apache2 libapache2-mod-php5 git
wget https://getcomposer.org/installer -O composer-setup.php
sudo php composer-setup.php --filename=composer --install-dir=/usr/local/bin
Setup php timezone by editing date.timezone in /etc/php/7.0/cli/php.ini file
you can set it to Asia/Damascus for example.
Copy the application source code to apache data directory using this command
sudo cp -r LoggingInfrastructure/test_app /var/www/html
Create apache site configuration file at /etc/apache2/sites-available/site.conf
with the following content
<VirtualHost *:80>

	ServerAdmin mohsen47@hotmail.co.uk
	DocumentRoot /var/www/html/test_app/web


	ErrorLog ${APACHE_LOG_DIR}/test_error.log
	CustomLog ${APACHE_LOG_DIR}/test_access.log combined


	<Directory /var/www/html>
                Options -Indexes
  </Directory>
  <Directory /var/www/html/test_app/web>
    AllowOverride None
    Order Allow,Deny
    Allow from All
		<IfModule mod_rewrite.c>
      Options -MultiViews
      RewriteEngine On
	    RewriteCond %{REQUEST_FILENAME} !-f
      RewriteRule ^(.*)$ app.php [QSA,L]
	   </IfModule>
  </Directory>
	<Directory /var/www/html/test_app>
		Options FollowSymlinks
	</Directory>
	<Directory /var/www/html/test_app/web/bundles>
		<IfModule mod_rewrite.c>
      RewriteEngine Off
	   </IfModule>
	</Directory>
</VirtualHost>

# vim: syntax=apache ts=4 sw=4 sts=4 sr noet
Now we must run composer to install symfony and its dependencies to vendor directory
cd /var/www/html/test_app
sudo composer install -n
sudo mkdir var/sessions
sudo chown -R www-data:www-data var/cache
sudo chown -R www-data:www-data var/logs
sudo chown -R www-data:www-data var/sessions
Enable apache2 rewrite module and site
sudo a2enmod rewrite
sudo a2ensite site
sudo a2dissite 000-default.conf
sudo service apache2 restart
Now the application is up and running you can use it by visiting this url in
your browser http://<ip_address>/app_dev.php/test this page shows a form with
one input enter your name for example in the field then browse to kibana for
viewing the message you entered as described in next section.
Kibana Index Pattern
Kibana is used to visualize elasticsearch indexes so the first thing you need to do is create an index pattern which contains the name of index you want to visualize.
Open kibana main interface http://<ip_address>:5601
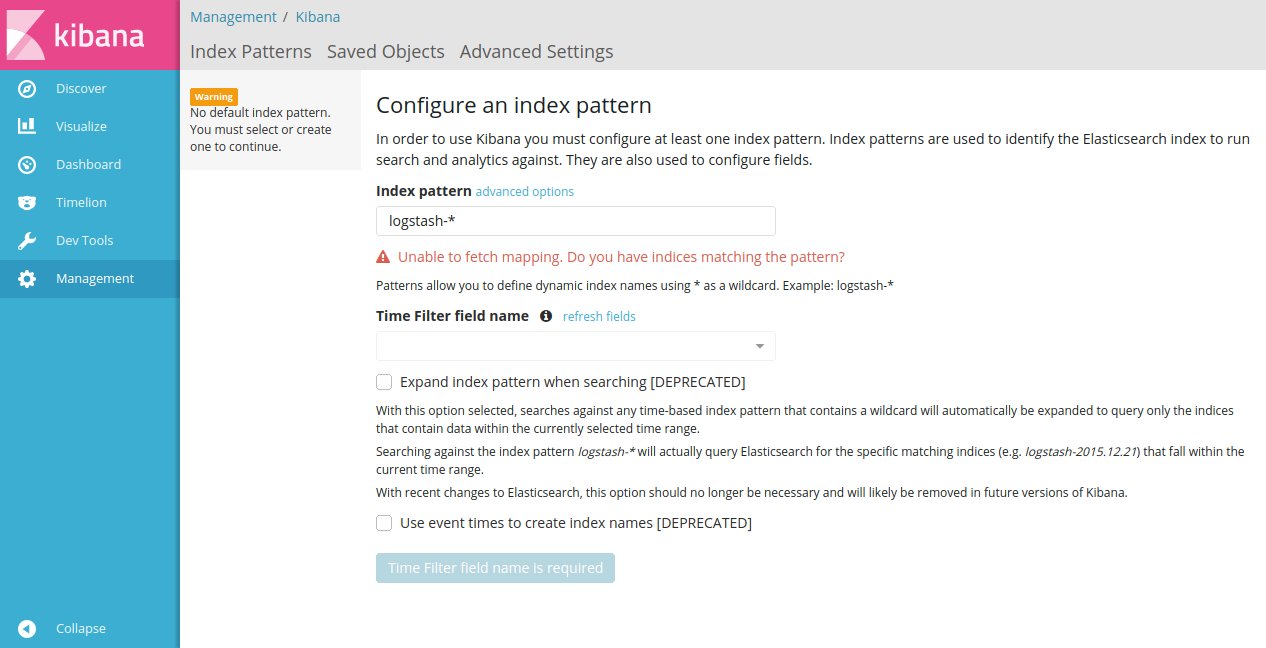
In the index pattern field enter logs_data then click create, now you can browse
the data in your index in the Discover tab at the left of the screen.
At the top of the page there is a search bar you can enter message:"hello" in
the search bar to find all log records that contain hello in the message field,
you can experiment with sending logs with different messages and searching for
them in kibana web interface.
This guide will not describe how to use kibana for more information check kibana documentation.
Expected issues
If you are experiencing any errors you can make sure that all components are running with these commands:
sudo service rabbitmq-server status
sudo service logstash status
sudo confluent log connect
sudo service elasticsearch status
sudo service kibana status
The third command shows the output of kafka-connect service if you can see any errors just reload kafka-connect-elasticsearch with these two commands
sudo confluent unload elasticsearch-sink
sudo confluent load elasticsearch-sink
If you are still experiencing any issues please leave a comment below or contact me at mohsen47@hotmail.co.uk and I will be very happy to help you.
Future Work
This is only an alpha version of my work I will be working to fix all issues and improve this infrastructure in the near future, my current plans include:
- Fix data loss when apache kafka is down, I noticed that data is lost when kafka server is disconnected for any reason, I will be investigating this bug very soon and release a solution in the near future.
- Enable processing of data at apache kafka topics before they are sent to elasticsearch I will use Kafka streams API to process data, this processing may include replacing numeric user IDs with real user names from the password or doing any calculation on the data.
- Investigate the scalability of the system and propose using it in a real web application running behind a load balancer.
- Describe deployment with ansible playbook.
Any issues or suggestion are welcome on my github repository issue tracker.