Run a single node ELK cluster using docker compose
Introduction
ELK or as known today as elastic stack is a complete solution for monitoring, analyzing and visualizing your logs and any data you store in your elasticsearch nodes, it consists of three main components Elasticsearch, Logstash and Kibana, we can also add Beats to them.
- Elasticsearch: Is the heart of the ELK stack, this is where your data is stored and indexed for later retrieval and visualization.
- Logstash: Is the point where all of your logs can be read, processed and stored in elasticsearch indices.
- Kibana: Is the visualization and analytics layer, it can be used to visualize the data you have in elasticsearch using dashboards and graphs.
- Beats: Is a group of low overhead logs and data shippers, it can be installed on your servers or clusters and be configured to send different kinds of data such as logs, captured packets, system metrics to elasticsearch directly or through logstash.
In this tutorial we will:
- Learn the basics about ELK stack and Beats.
- Deploy a single node ELK stack using docker compose.
- Use filebeat to read log lines from a file and send them to ELK stack and view them in Kibana.
ELK Componenets
Here we will talk briefly about every component in the ELK stack and how it works, let us start with Elasticsearch.
Elasticsearch
elasticsearch is the heart of the stack, it is used to store, index and search the various kinds of data you throw in it, it is based on Apache Lucene and written in Java, you can run it using a single node or using a cluster of multiple nodes, its main components are:
- Index: The indices in elasticsearch hold your data, it is equivalent to a database in SQL database systems, you can have as many indices as you want in your cluster.
- Documents: Documents are the actual data stored in indices, it is equivalent to a table row in SQL database systems, you don’t need to specify a schema for documents as elasticsearch creates one when you create documents.
- Mapping: A mapping is like a table schema in SQL database systems, you can create one explicitly or let elasticsearch dynamically create mappings for the documents you add to indices.
- Shards and Replicas: An index could become very large, in order for elasticsearch to be able to store data in different nodes it shards the index data based on some criterias and distribute it to multiple nodes, it also creates replicas for these shards and store them on multiple nodes to allow for recovering from node failures.
You can use the elasticsearch REST API to search inside your indices, in our setup here we will not be using elasticsearch directly, logstash will write data to it and kibana will read data from it.
Logstash
Logstash is the central point for receiving logs and metrics, parsing it and sending the results to elasticsearch, it has these three main components:
- Inputs: Here we define what kind of inputs will be used by logstash to read data, it could be a simple file, beats input, http input etc….
- Filters: Here we apply some parsing rules on input data before sending it to outputs, the most common filters are grok, date, mutate and drop etc….
- Outputs: Here we define where the data will be sent after it is read and parsed, it could be elasticsearch, File, S3 buckets, message queues etc…
In our setup logstash will read the data from filebeat and send it to elasticsearch.
Kibana
kibana is a visualization and analytical tool, it can read data from elasticsearch indices and offer it in a nice user interafce, you can also write queries in the interface and see the results, you can also create dashboards and many graphs to see the data, also create alerts and many other services.
In our setup it will be used to read from elasticsearch.
Beats
Beats were added late to the stack, that is why we don’t have a B in the name,
they are very light weight shippers that can be installed on your servers or clusters and be used to send data to logstash or elasticsearch directly.
There are different kind sof beats:
-
File Beats: These are used to send log lines from files to logstash or elasticsearch, they can tail a file or group of files and send new lines only, they use a regsitry file to record how many lines did they send from each file to avoid re-sending lines again.
-
Packet Beats: These are used to capture the network traffic on interafces and send it to logstash or elasticsearch.
-
Metric Beats: These collect system metrics such as CPU, memory, disk etc… and send them to logstash or elasticsearch.
-
Winlogbeat: This is used by Windows sysadmins to send windows logs to either logstash or elasticsearch.
-
Audit Beats: They are used on Linux systems to send audit logs to logstash or elasticsearch, this could be useful to detect security breaches such as user logins, process activity or file and configuration changes.
In our setup we will use filebeat to send data from a log file to logstash.
For more information about the ELK stack, check out this guide on logz.io.
Docker Compose Setup
Now after we learned about the various components of the ELK stack, let us start by writing a docker compose file to be used for running all of these components except for filebeat which will be installed directly on our machine.
Create a new directory for the code which you will write now, you can create it with this command but you are free to change the location.
mkdir ~/elk-compose
cd ~/elk-compose
Create a file called .env with this content:
# Password for the 'elastic' user (at least 6 characters)
ELASTIC_PASSWORD=change_me

# Password for the 'kibana_system' user (at least 6 characters)
KIBANA_PASSWORD=change_me

# Version of Elastic products
STACK_VERSION=8.0.0

# Set to 'basic' or 'trial' to automatically start the 30-day trial
LICENSE=basic
#LICENSE=trial

# Port to expose Elasticsearch HTTP API to the host
ES_PORT=9200

# Port to expose Kibana to the host
KIBANA_PORT=5601
This file will be loaded by docker-compose command and create environment variables for all the variables defined in it, make
sure to change the values for KIBANA_PASSWORD and ELASTIC_PASSWORD.
We are using the latest version of the stack, also using the basic license.
Create a file called docker-compose.yaml with this content:
version: "2.2"

services:
  setup:
    image: docker.elastic.co/elasticsearch/elasticsearch:${STACK_VERSION}
    user: "0"
    command: >
      bash -c '
        if [ x${ELASTIC_PASSWORD} == x ]; then
          echo "Set the ELASTIC_PASSWORD environment variable in the .env file";
          exit 1;
        elif [ x${KIBANA_PASSWORD} == x ]; then
          echo "Set the KIBANA_PASSWORD environment variable in the .env file";
          exit 1;
        fi;
        echo "Waiting for Elasticsearch availability";
        until curl -s http://es:9200 | grep -q "missing authentication credentials"; do sleep 30; done;
        echo "Setting kibana_system password";
        until curl -s -X POST -u elastic:${ELASTIC_PASSWORD} -H "Content-Type: application/json" http://es:9200/_security/user/kibana_system/_password -d "{\"password\":\"${KIBANA_PASSWORD}\"}" | grep -q "^{}"; do sleep 10; done;
        echo "All done!";
      '
  es:
    image: docker.elastic.co/elasticsearch/elasticsearch:${STACK_VERSION}
    volumes:
      - esdata:/usr/share/elasticsearch/data
    ports:
      - ${ES_PORT}:9200
    environment:
      - node.name=es
      - discovery.type=single-node
      - ELASTIC_PASSWORD=${ELASTIC_PASSWORD}
      - xpack.security.enabled=true
      - xpack.license.self_generated.type=${LICENSE}
    healthcheck:
      test:
        [
          "CMD-SHELL",
          "curl -s http://localhost:9200 | grep -q 'missing authentication credentials'",
        ]
      interval: 10s
      timeout: 10s
      retries: 120
volumes:
  esdata:
    driver: local
Here we have two services the first is called setup, it only checks if password variables are defined and also sets the
password for kibana_system user, the second service is the actual elasticsearch instance, it has a persistent volume to make sure
we don’t lose data in case the container was deleted.
Let us try to run this cluster now with this command:
docker-compose up
Now you can test that your cluster is up and running with this command
> curl localhost:9200/ -u elastic
Enter host password for user 'elastic':
{
  "name" : "es",
  "cluster_name" : "docker-cluster",
  "cluster_uuid" : "sMj2SHU1SXuy_rTFqNXHzw",
  "version" : {
    "number" : "8.0.0",
    "build_flavor" : "default",
    "build_type" : "docker",
    "build_hash" : "1b6a7ece17463df5ff54a3e1302d825889aa1161",
    "build_date" : "2022-02-03T16:47:57.507843096Z",
    "build_snapshot" : false,
    "lucene_version" : "9.0.0",
    "minimum_wire_compatibility_version" : "7.17.0",
    "minimum_index_compatibility_version" : "7.0.0"
  },
  "tagline" : "You Know, for Search"
}
Make sure to use the password that you specified for your elastic super user.
You can also try to login using your kibana_system user, this will be used later by kibana.
curl localhost:9200/ -u kibana_system
You will get the same output as above.
Now we will add logstash to the setup with this config:
logstash:
    depends_on:
      es:
        condition: service_healthy
    image: docker.elastic.co/logstash/logstash:${STACK_VERSION}
    volumes:
      - ./logstash/config/logstash.yml:/usr/share/logstash/config/logstash.yml:ro,Z
      - ./logstash/pipeline:/usr/share/logstash/pipeline:ro,Z
    ports:
      - "5044:5044"
      - "5000:5000/tcp"
      - "5000:5000/udp"
      - "9600:9600"
Here we define a new service called logstash which runs our logstash instance, in the volumes section we mount
one volume into /usr/share/logstash/pipeline which is where logstash expects to find its pipelines and mount a custom
logstash.yml file to configure logstash using it.
Create a file called logstash.yml in ./logstash/config directory with this content:
---
## Default Logstash configuration from Logstash base image.
## https://github.com/elastic/logstash/blob/master/docker/data/logstash/config/logstash-full.yml
#
http.host: "0.0.0.0"
We only set http.host here and everything else will be reset, especially the default value for elasticsearch
host which is elasticsearch:9200, if this was used it will cause error logs because we don’t have a service
called elasticsearch it is called es.
Create a new file called logstash.conf in ./logstash/pipeline directory with this content:
input {
	beats {
		port => 5044
	}
}

## Add your filters / logstash plugins configuration here

output {
	elasticsearch {
		hosts => "es:9200"
		user => "elastic"
		password => "change_me"
	}
}
Here we are defining a basic logstash pipeline without any filters, we read from beats on port 5044 and send to elasticsearch
on host called es and port 9200, we need to provide the username and password here to index data in elasticsearch.
HINT: The password is used here as plain text for demonstration only, I will update the tutorial later to securily store and read this password.
Now stop your docker-compose command with CTRL+C and run it again with the new config, there is nothing to check now, we will see how file beat will send data to logstash in a moment.
Now we will add the last service to the docker-compose file, that is kibana
kibana:
    depends_on:
      es:
        condition: service_healthy
    image: docker.elastic.co/kibana/kibana:${STACK_VERSION}
    volumes:
      - kibanadata:/usr/share/kibana/data
    ports:
      - ${KIBANA_PORT}:5601
    environment:
      - SERVERNAME=kibana
      - ELASTICSEARCH_HOSTS=http://es:9200
      - ELASTICSEARCH_USERNAME=kibana_system
      - ELASTICSEARCH_PASSWORD=${KIBANA_PASSWORD}
    healthcheck:
      test:
        [
          "CMD-SHELL",
          "curl -s -I http://localhost:5601 | grep -q 'HTTP/1.1 302 Found'",
        ]
      interval: 10s
      timeout: 10s
      retries: 120
Nothing more to say about kibana, it only has a new volume called kibanadata which must be added to the volumes list
at the end of the docker-compose file
  kibanadata:
    driver: local
Now stop docker-compose and run it again with this command
docker-compose up
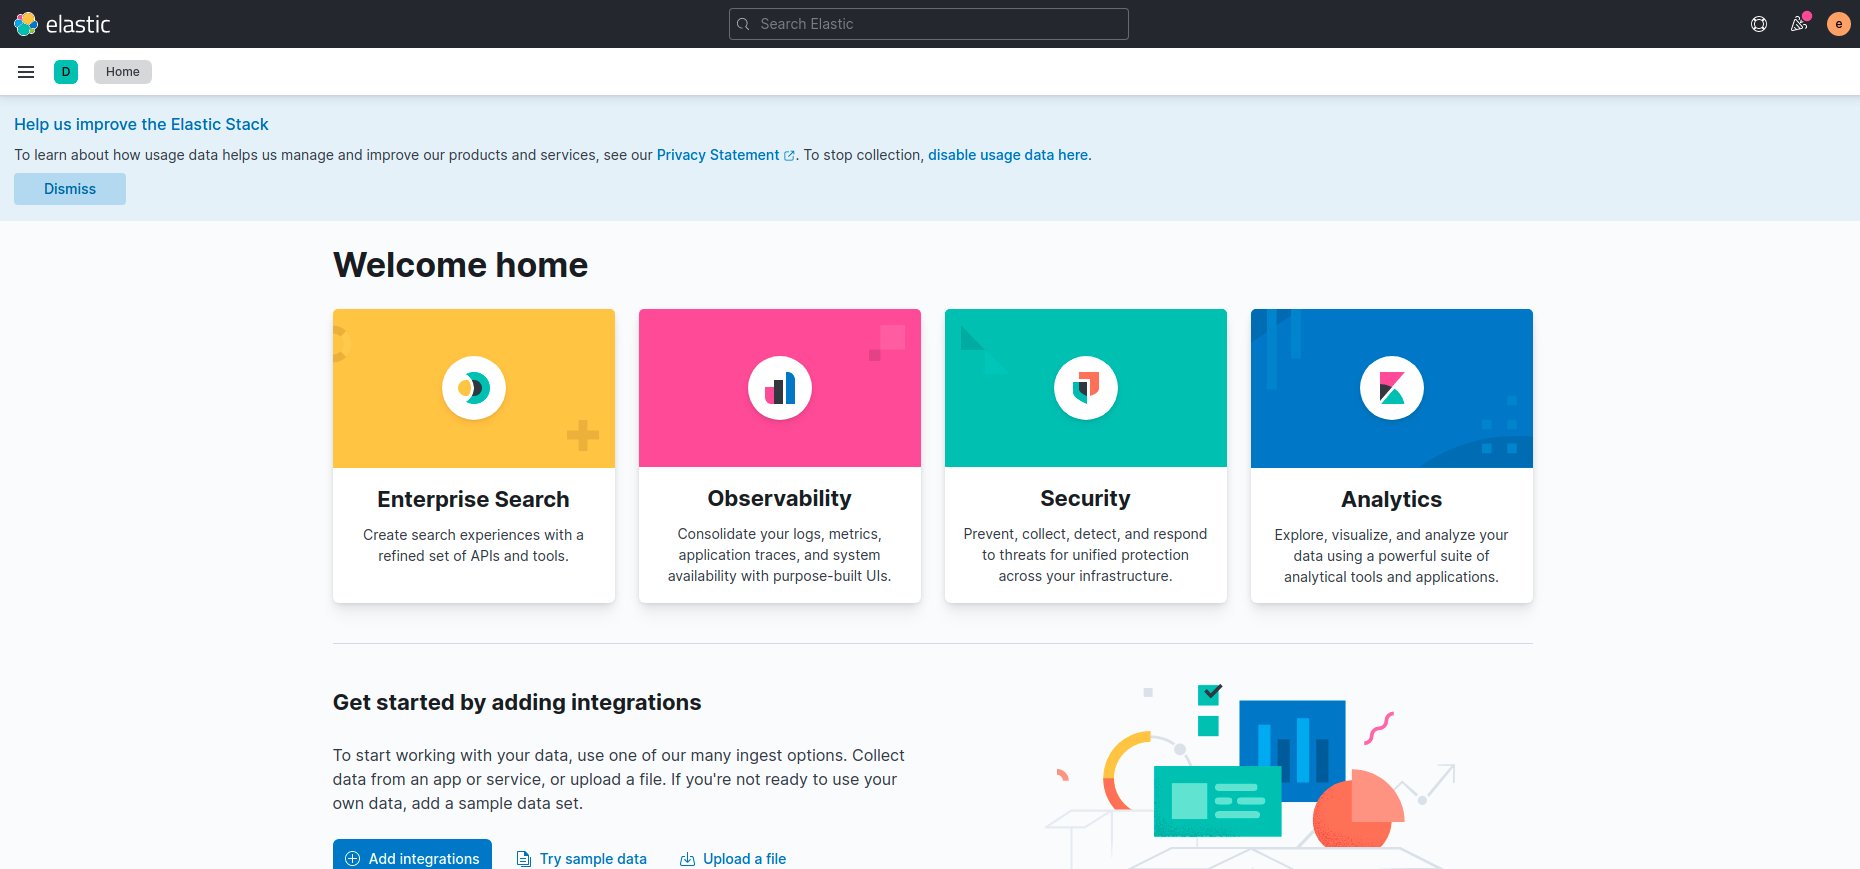
Use your browser to open kibana using this URL http://localhost:5601, login with your elastic username
and password.
Let us have a look at the dev tools on this URL http://localhost:5601/app/dev_tools#/console

Type GET _cat/indices and hit the run button, the green triangle to the right, you will get nothing in the other pane because
elasticsearch is currently empty, next we will send data to elasticsearch from our file beat.
File beat will be installed directly to your machine, if you are running Linux use these commands
curl -L -O https://artifacts.elastic.co/downloads/beats/filebeat/filebeat-8.0.0-linux-x86_64.tar.gz
tar xzvf filebeat-8.0.0-linux-x86_64.tar.gz
For other systems check here
Create a filebeat.yml configuration file with this content
# ============================== Filebeat inputs ===============================

filebeat.inputs:

# Each - is an input. Most options can be set at the input level, so
# you can use different inputs for various configurations.
# Below are the input specific configurations.

# filestream is an input for collecting log messages from files.
- type: filestream

  # Change to true to enable this input configuration.
  enabled: true

  # Paths that should be crawled and fetched. Glob based paths.
  paths:
    - test.log
# ------------------------------ Logstash Output -------------------------------
output.logstash:
  # The Logstash hosts
  hosts: ["localhost:5044"]
In this config we are reading data from a file called test.log and writing it to logstash on localhost:5044.
Make sure this file is writeable by its owner onyl with this command
chmod go-w filebeat.yml
Create a file called test.log with some sample content
This is a log line
Another log line
Hi last log line
This is only for testing, real log lines must also contain a timestamp field, in our case elasticsearch will use the time the log line was indexed as its timestamp.
Start filebeat process in another terminal with this command:
./filebeat-8.0.0-linux-x86_64/filebeat
Now check kibana console output again, wait few seconds until the file is indexed by elasticsearch.
You should now see a new index like this yellow open .ds-logs-generic-default-2022.02.13-000001 Hip5I_zESw2SmLfAuA0x9A 1 1 3 0 20.6kb 20.6kb
which means that the file contents were read by filebeat, sent to logstash and finally indexed in elasticsearch.
To see the data we have first to create a new data view, go to this URL http://localhost:5601/app/management/kibana/dataViews and click on Create data view
Use logs-generic-default* as name, the name is actually a simple Regular expression to match a group of indices in elasticsearch, select @timestamp
as timestamp field and click create data view.

After that go to discover page on this URL http://localhost:5601/app/discover
Select logs-generic-default* from drop down menu and you will find three results, click on them and check the message field, it contains
the lines from your file, in our case the log lines were sent as a single field, later we will see how can we parse these lines and create
new fields from them to help us in querying our logs.
Conclusion
In this tutorial we learned the basics about the ELK stack and how to install it using docker-compose, we used file beat to send log lines from a single file into logstash and then to elasticsearch, eventually the data was viewed using kibana.
In later tutorials we will leanr how to process data using logstash filters, and create nice dashboards in kibana. We will also learn how to use metric and packet beats to monitor our servers and all network packets flowing through our infrastructure.
I am using the ELK stack to read and analyze logs in my own project where I am building a tool to manage different kinds of resources in a mono repo, it allows you to build, test, publish and deploy resources easily and ELK will help me to understand its performance and how it can be improved, I will post about this project very soon :) :)
I hope you find the content useful for any comments or questions you can contact me on my email address mouhsen.ibrahim@gmail.com
Stay tuned for more tutorials. :) :)